SIU Representative Workforce, January 2026
The Numbers
| Employee Categories, As of January 2026. | Sex | Diversity | ||||
|---|---|---|---|---|---|---|
| Male | Female | Racialized Communities | Black | Indigenous | White | |
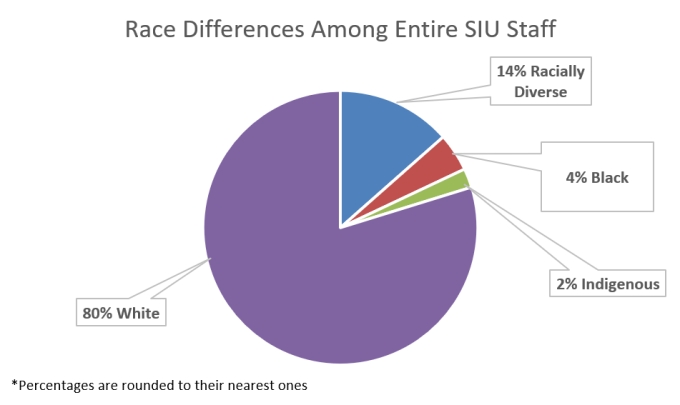
| All Staff (89) | 63% (56) | 37% (33) | 13% (12) | 5% (4) | 2% (2) | 80% (71) |
| Senior Leadership (12) | 42% (5) | 58% (7) | 8% (1) | 18% (2) | 8% (1) | 66% (8) |
| Administrative Professionals (12) | 42% (5) | 58% (7) | 58% (7) | 0% (0) | 0% (0) | 42%(5) |
| Other Professionals (11) | 27% (3) | 73% (8) | 27% (3) | 0% (0) | 0% (0) | 73% (8) |
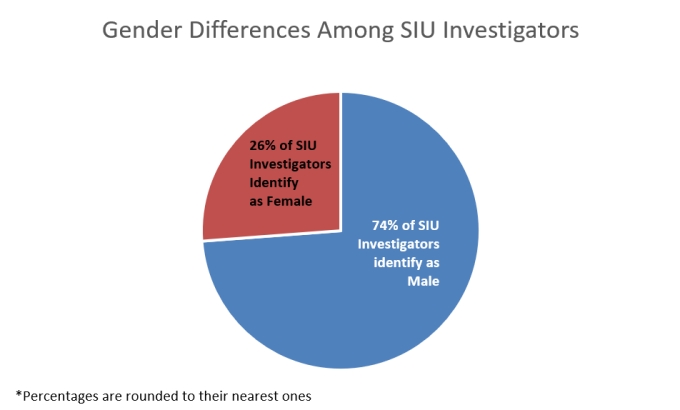
| Full-time Investigators (16) | 81% (13) | 19% (3) | 6% (1) | 0% (0) | 6% (1) | 88% (14) |
| As-needed Investigators (26) | 69% (18) | 31% (8) | 0% (0) | 8% (2) | 0% (0) | 92% (24) |
| Forensic Investigators (12) | 100% (12) | 0% (0) | 0% (0) | 0% (0) | 0% (0) | 100% (12) |
| Population (Source – Statistics Canada, 2021 Census of Population) | ||||||
| GTA (Metropolitan Area) | 49% | 51% | 57% | 8% | 1% | 43% |
| Ontario | 49% | 51% | 34% | 6% | 3% | 63% |
*Percentages are rounded to their nearest ones